🗺️ 30 Day Map Challenge 2022
I made five maps for the 2022 #30DayMapChallenge and had a lot of fun. They all seem to involved some cool satellite imagery or use 3D in a way that I wanted to try out.
- Day 18: Color Friday: Blue - Symphony Lake and Eagle Lake, Alaska in 3D
- Day 23: Movement - Animated AIS Data for Boston Harbor with gganimate
- Day 26: Islands - Exaggerated Hillshade of Volcanic Craters on St. Paul Island
- Day 28: 3D - Slope Angle 3D Perspective of Hatcher Pass, Alaska
- Day 30: Remix - Cold War Missile Site Imagery from 1964 and Modern Ski Trails at Kincaid Park
Day 18: Color Friday: Blue - Symphony Lake and Eagle Lake, Alaska 3D #
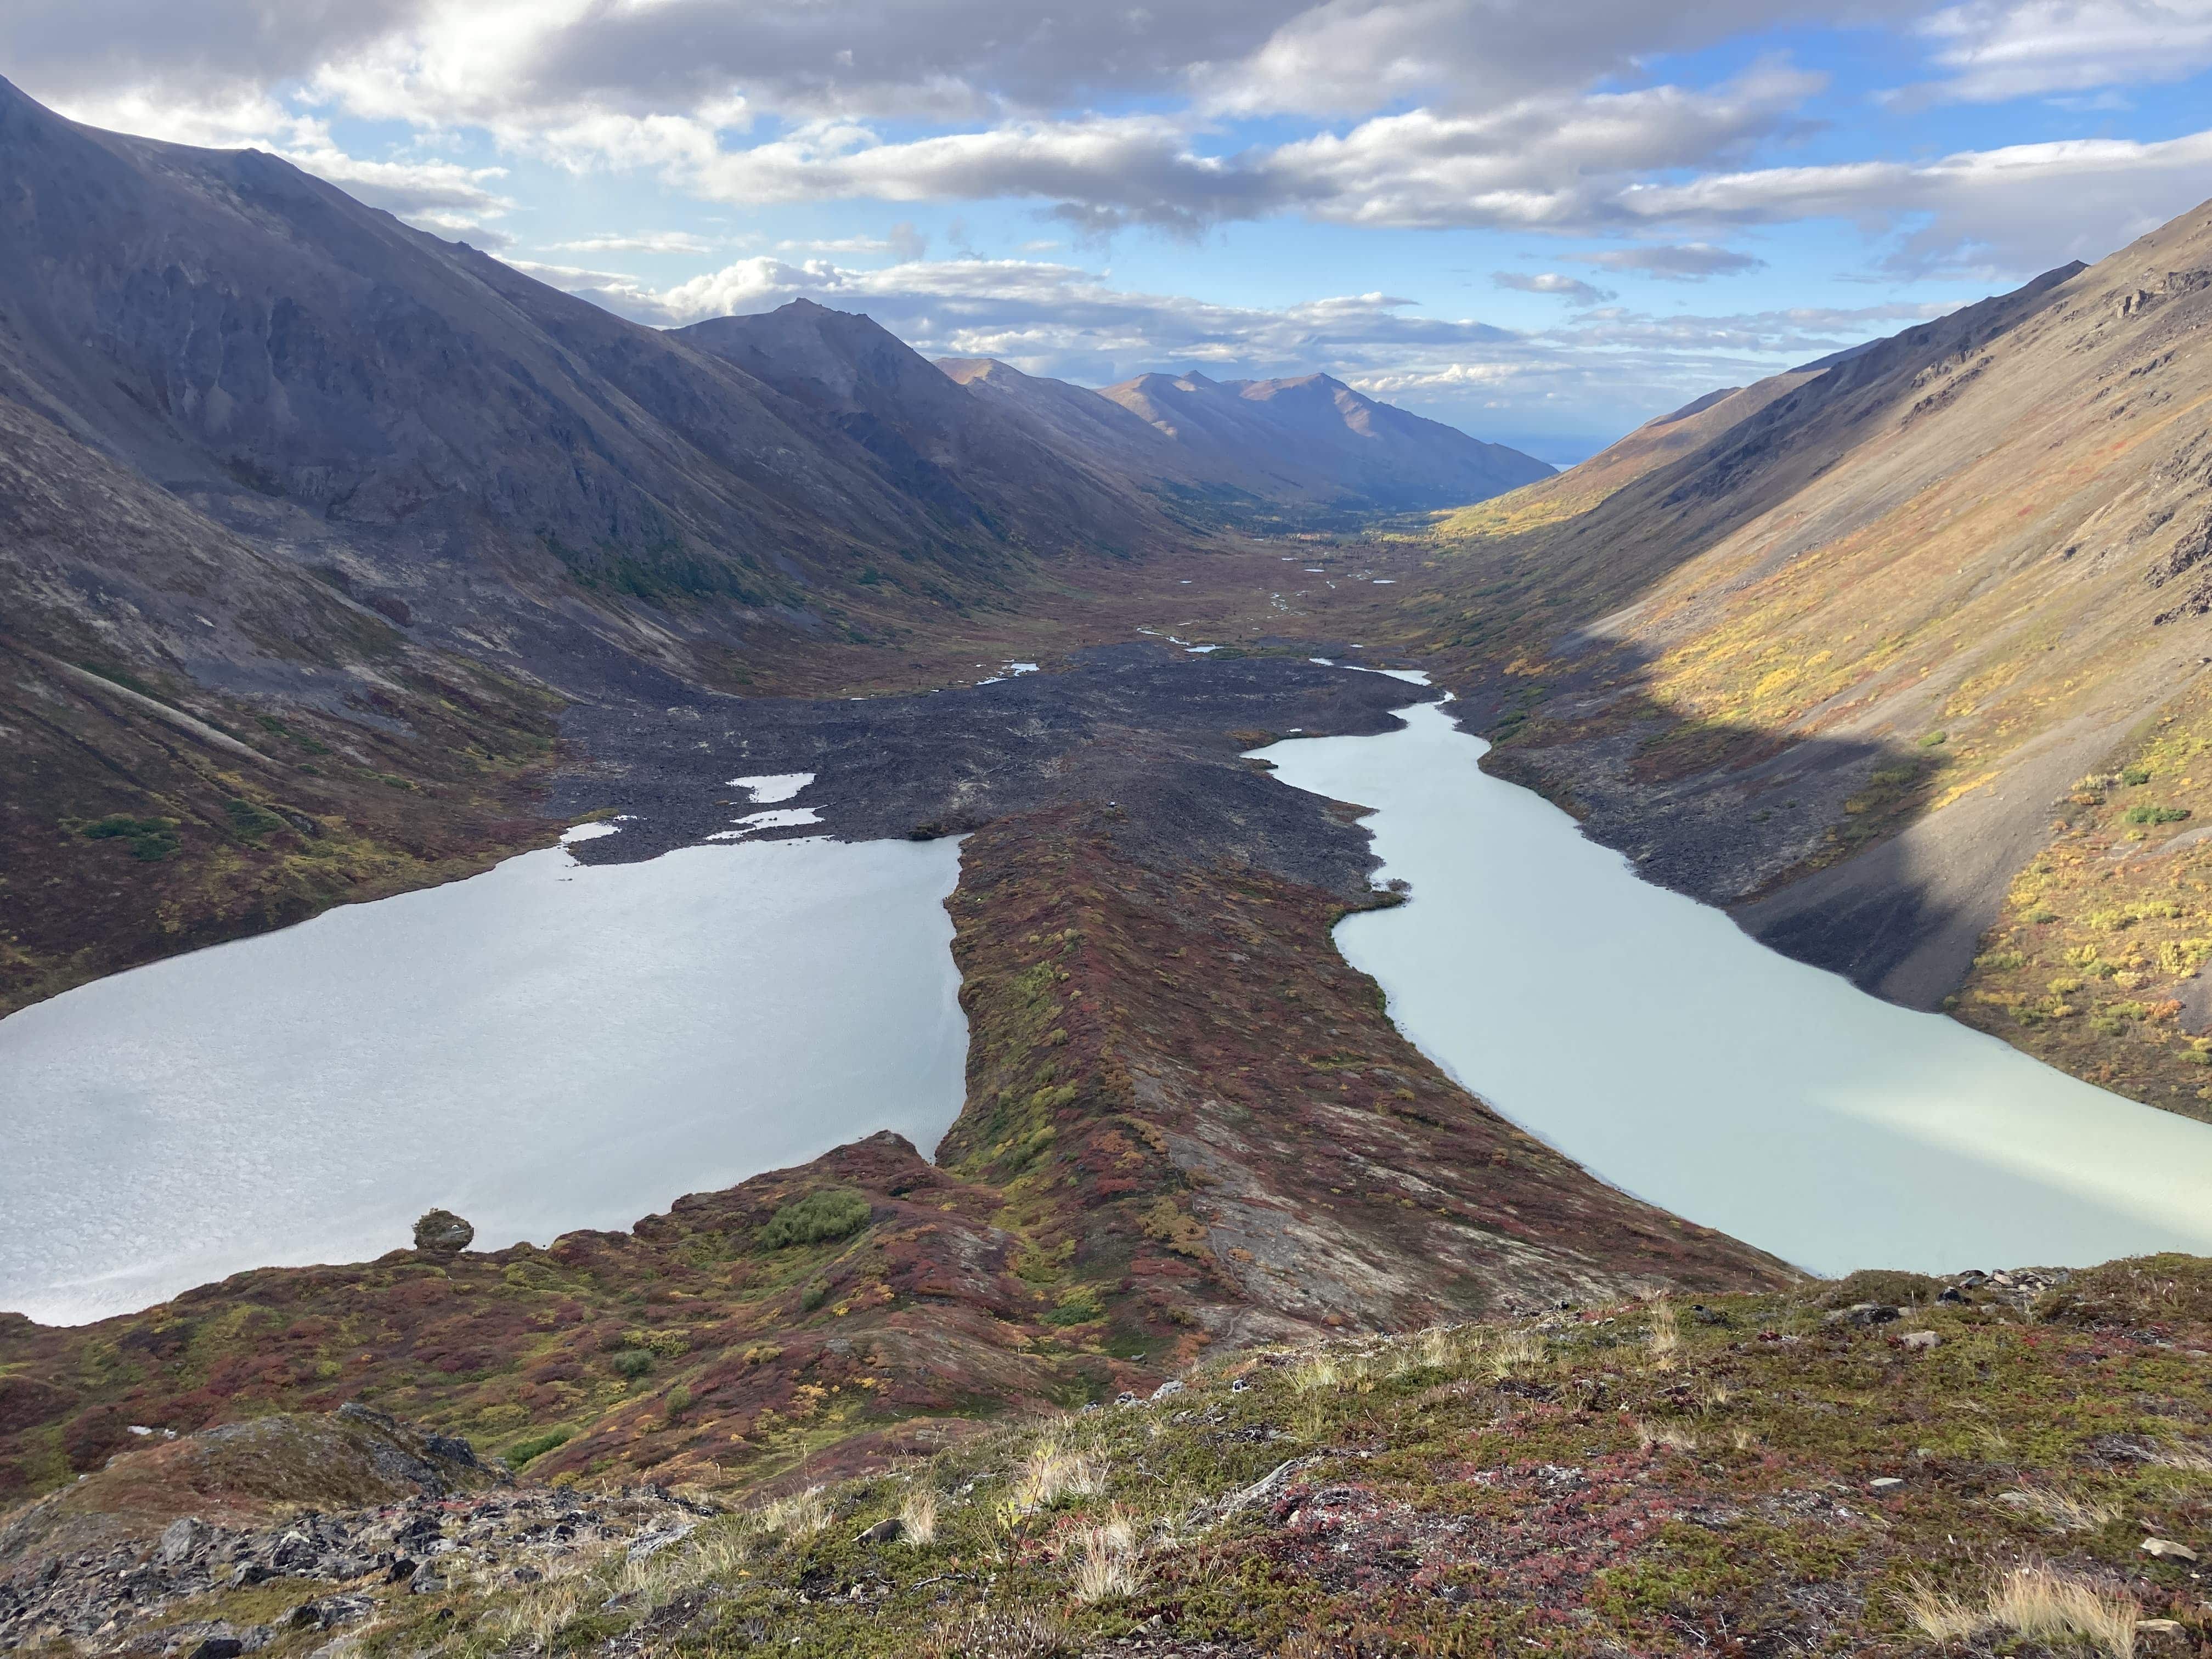
Two lakes — two very different blues. Eagle Lake and Symphony Lake are right next to each other but show off two very different colors. Eagle Lake is fed by a glacier 🧊 and Symphony Lake is not.
This uses Alaska’s Open Data imagery and USGS 3DEP elevation data + QGIS.
This is what the two lakes looked like in September when I was there.
Day 23: Movement - Animated AIS Data for Boston Harbor with gganimate #
Here is ~10 days of 🛥 🚢 ship traffic around Boston Harbor. This uses AIS data from NOAA’s Marine Cadastre program - 640,076 pings from ships to be exact.
I used #rstats gganimate for the motion. and Sentinel 2 imagery from EO Browser for the base layer.
I started with ship traffic around Duluth on Lake Superior, but I wanted more moving pieces so Boston. This took like an hour to render on my ancient laptop.
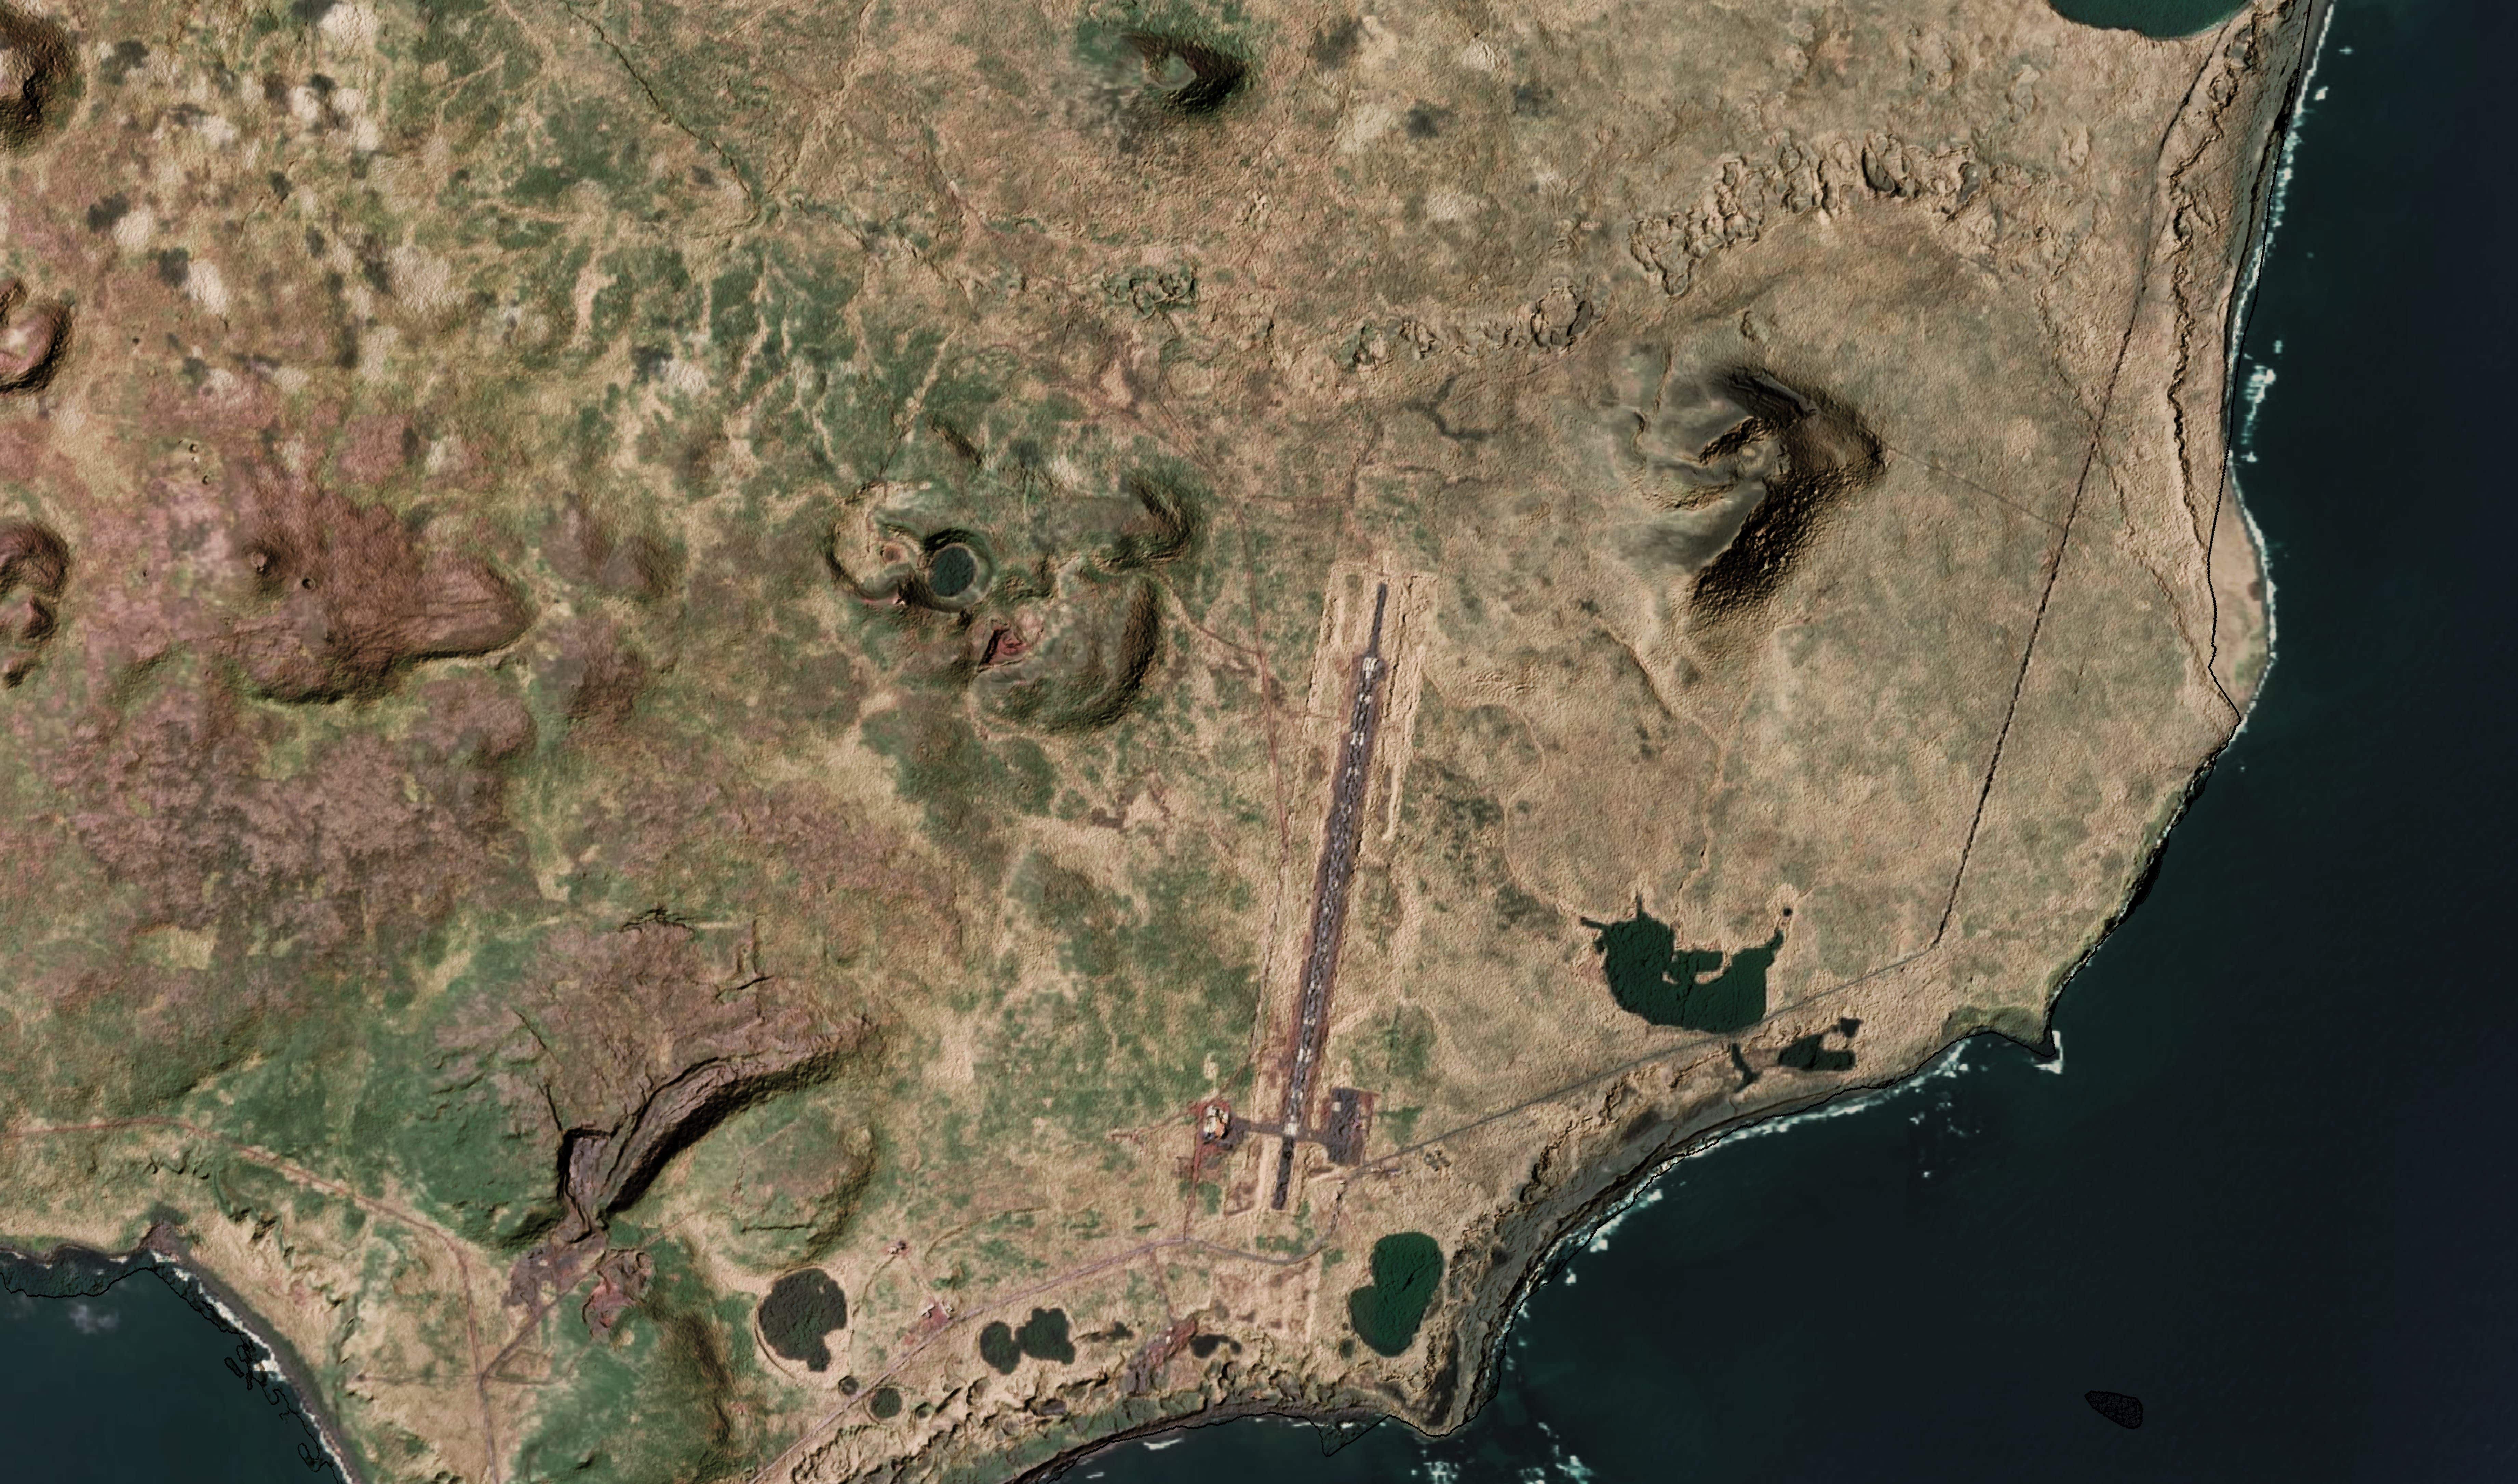
Day 26: Islands - Exaggerated Hillshade of Volcanic Craters on St. Paul Island #
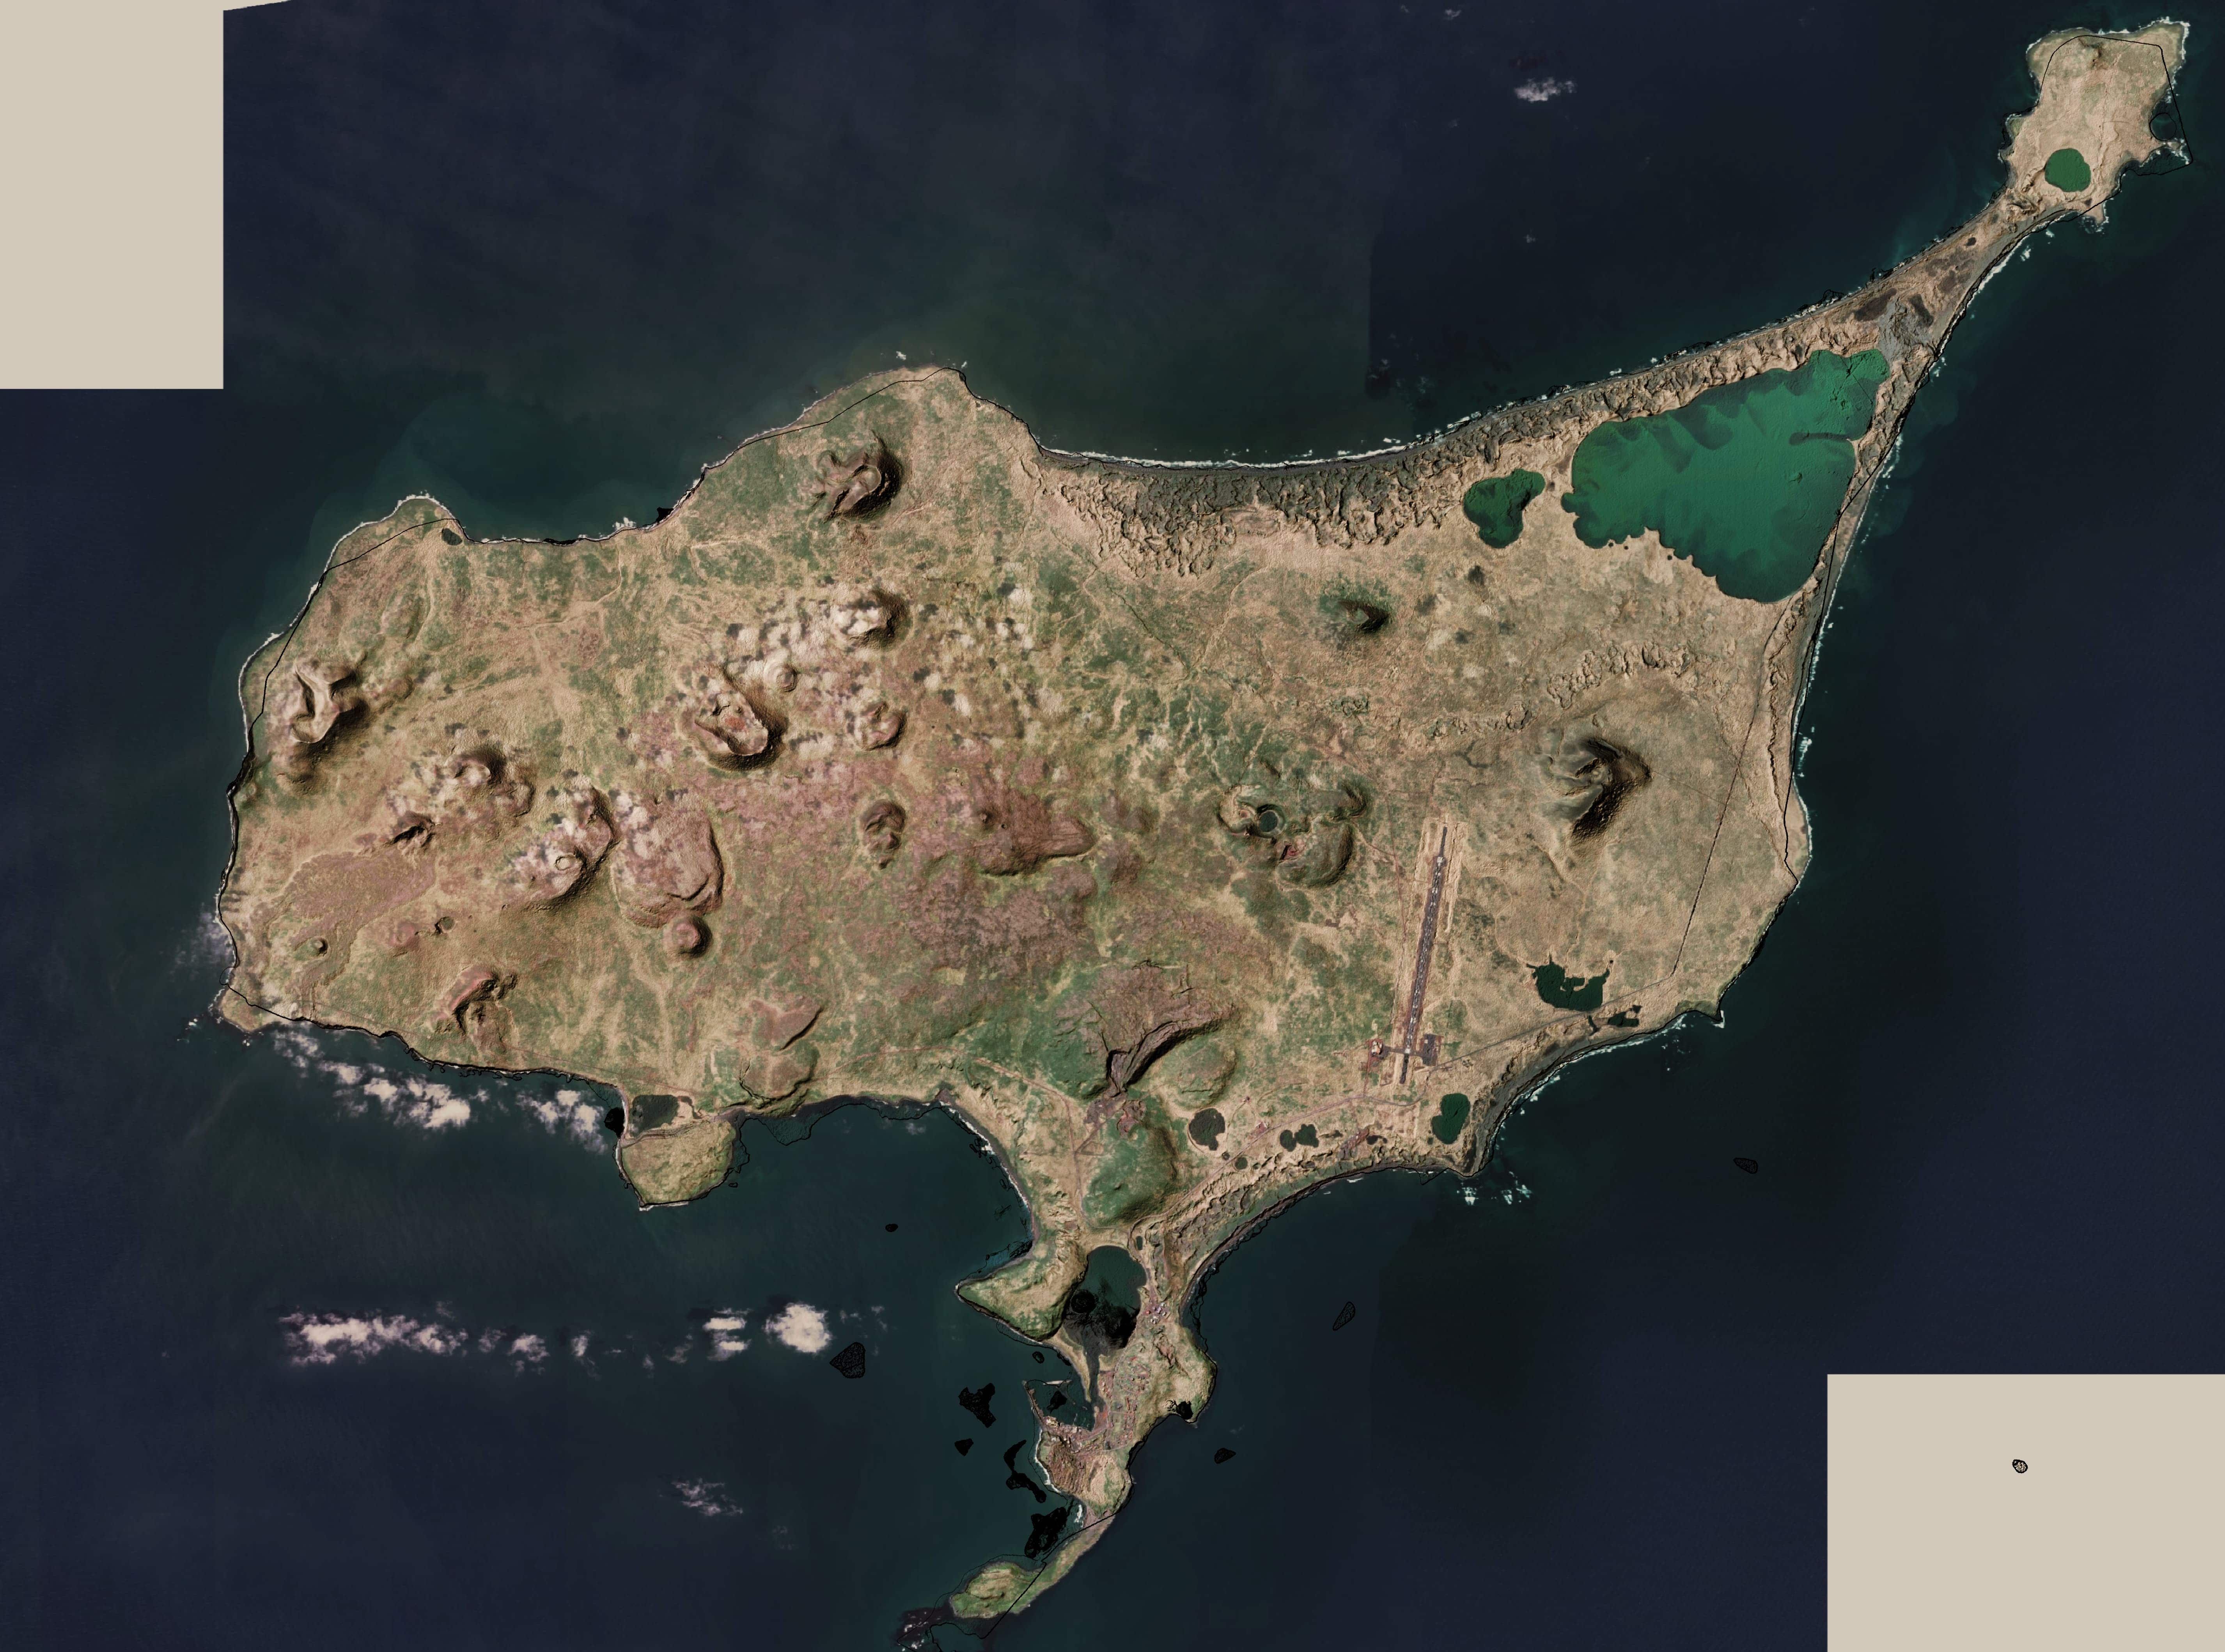
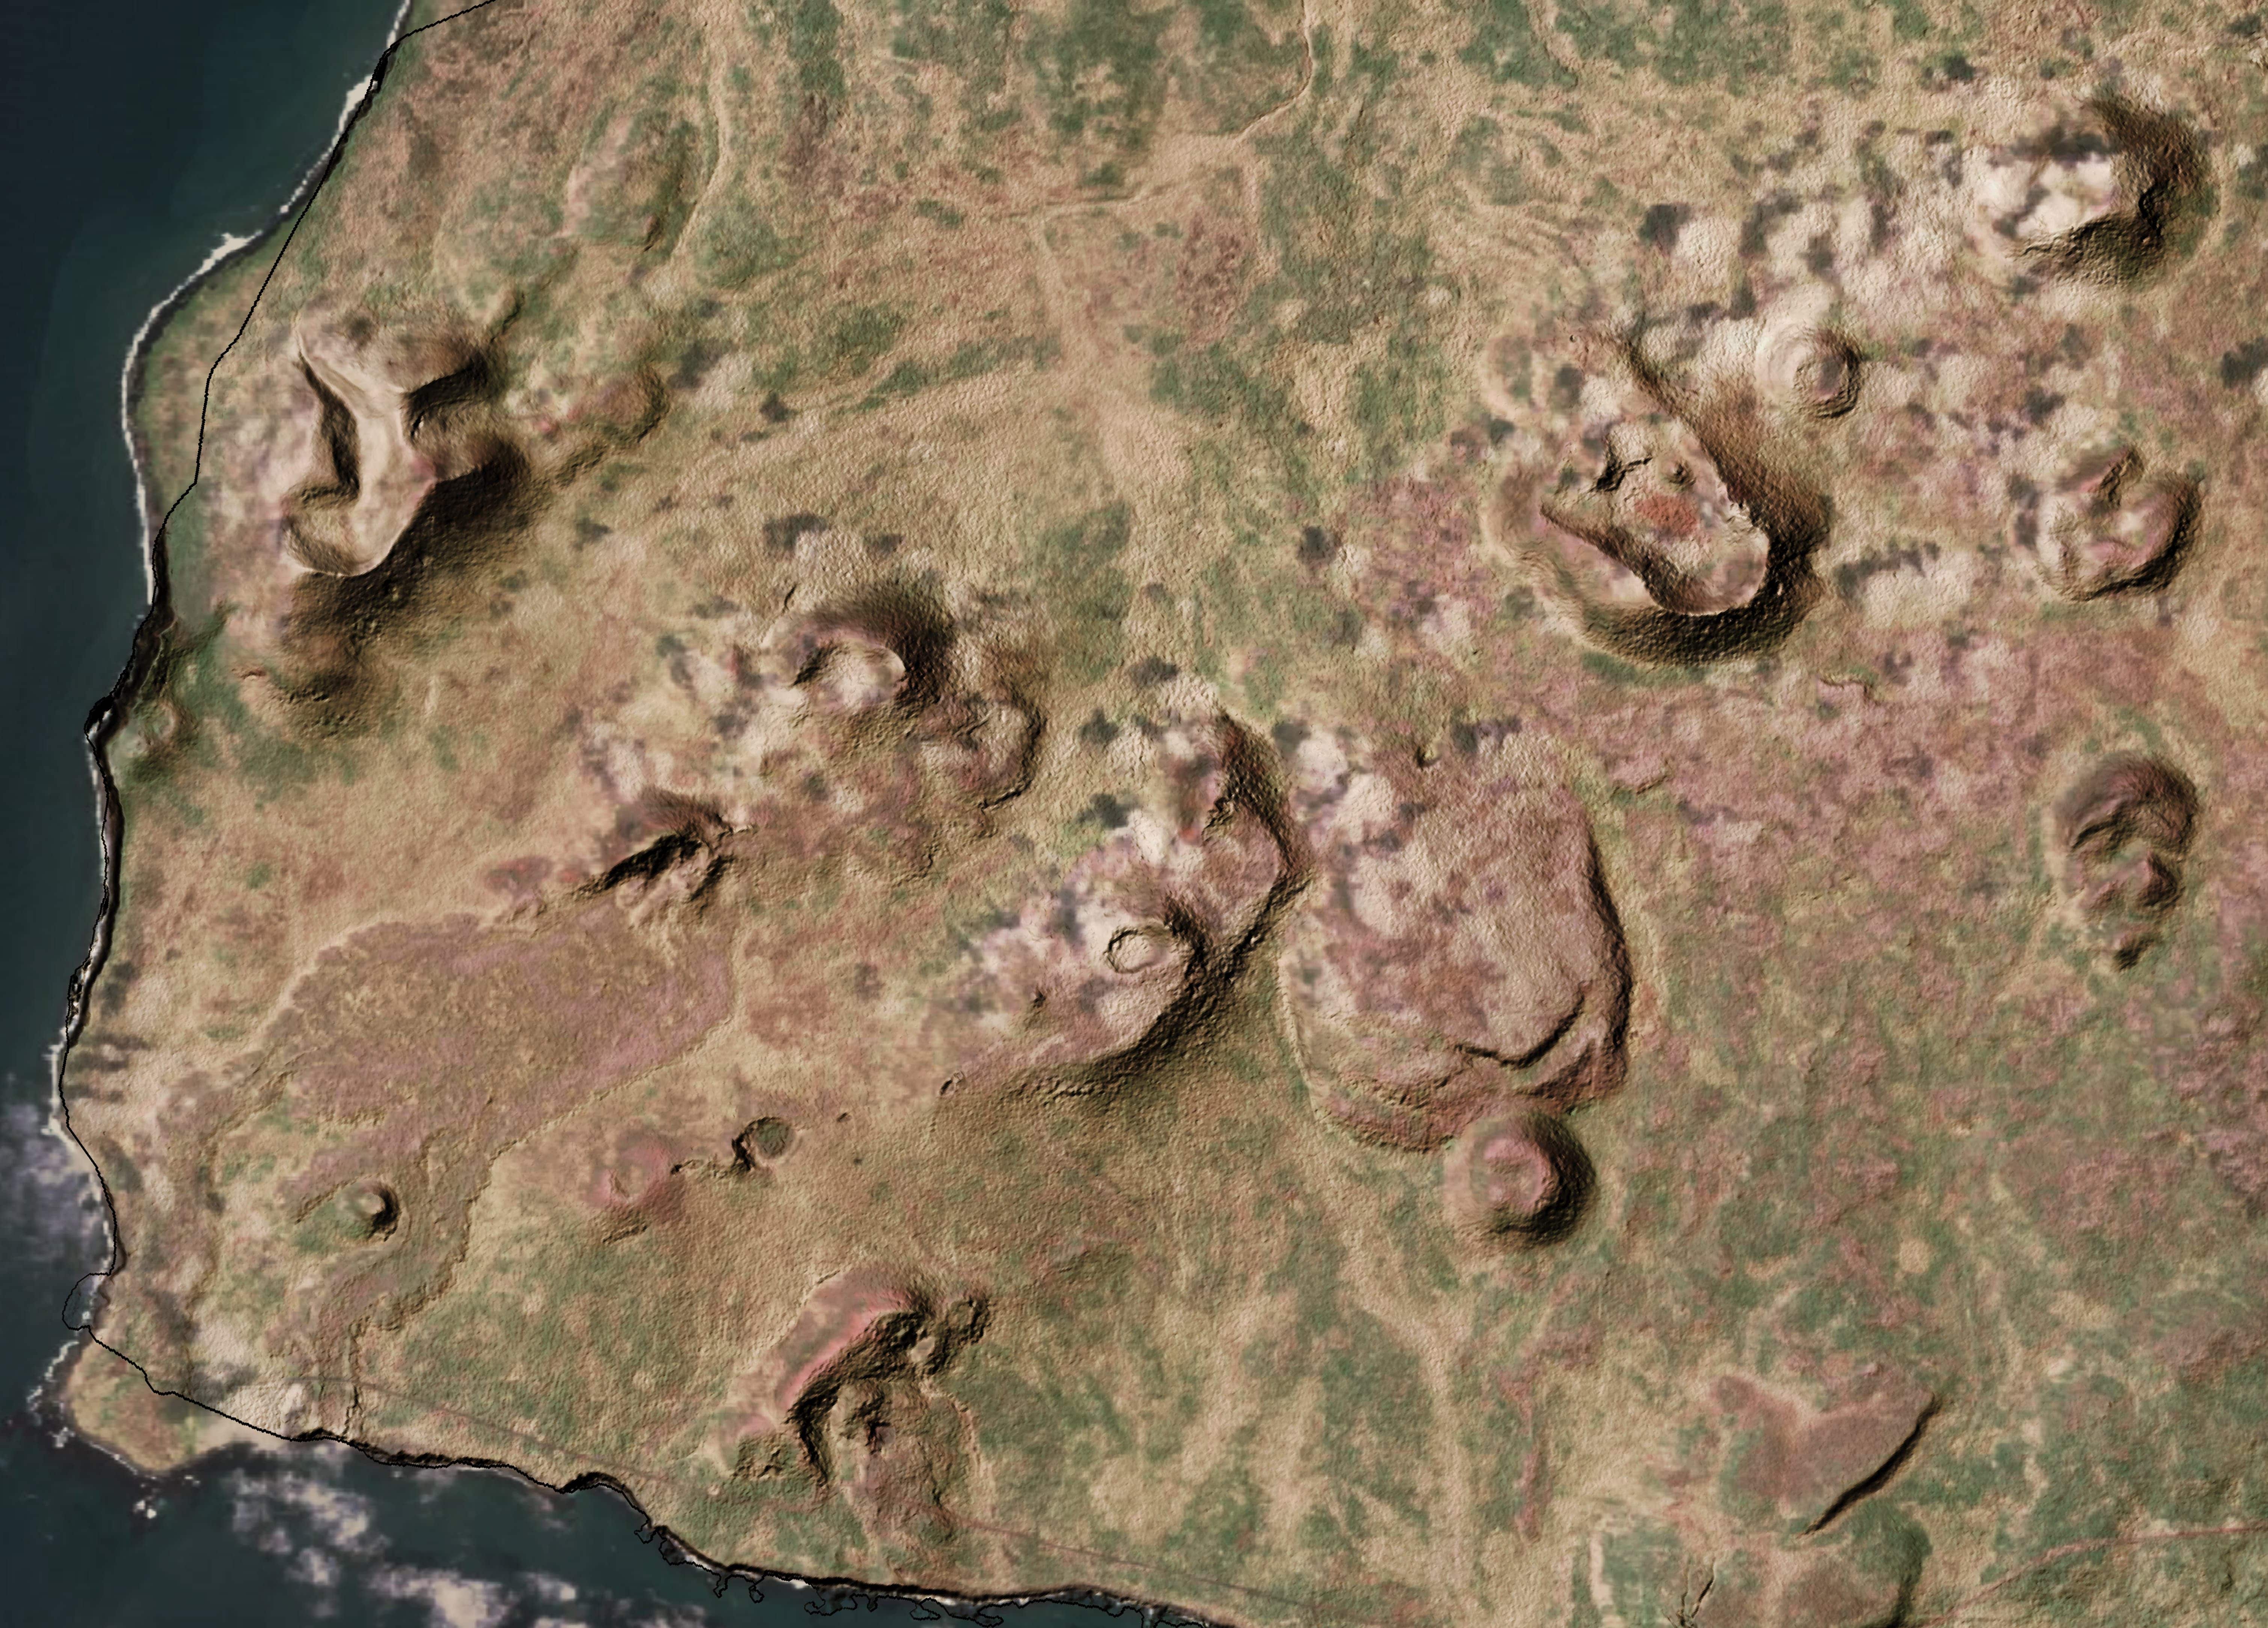
Here is the coolest island in Alaska - St. Paul Island. 🌋 St. Paul is full of cinder cones and volcanic craters. This map exaggerates the topography to show them off.
There are 40 “identifiable vents” based on one paper. According to the Alaska Volcano Observatory, there are “12-15 cones or cone complexes [that] exceed 0.5 km in basal diameter.” Plus lava flows.
My map uses elevation data from ArcticDEM and the State of Alaska Open Data imagery.
Day 28: 3D - Slope Angle 3D Perspective of Hatcher Pass, Alaska #
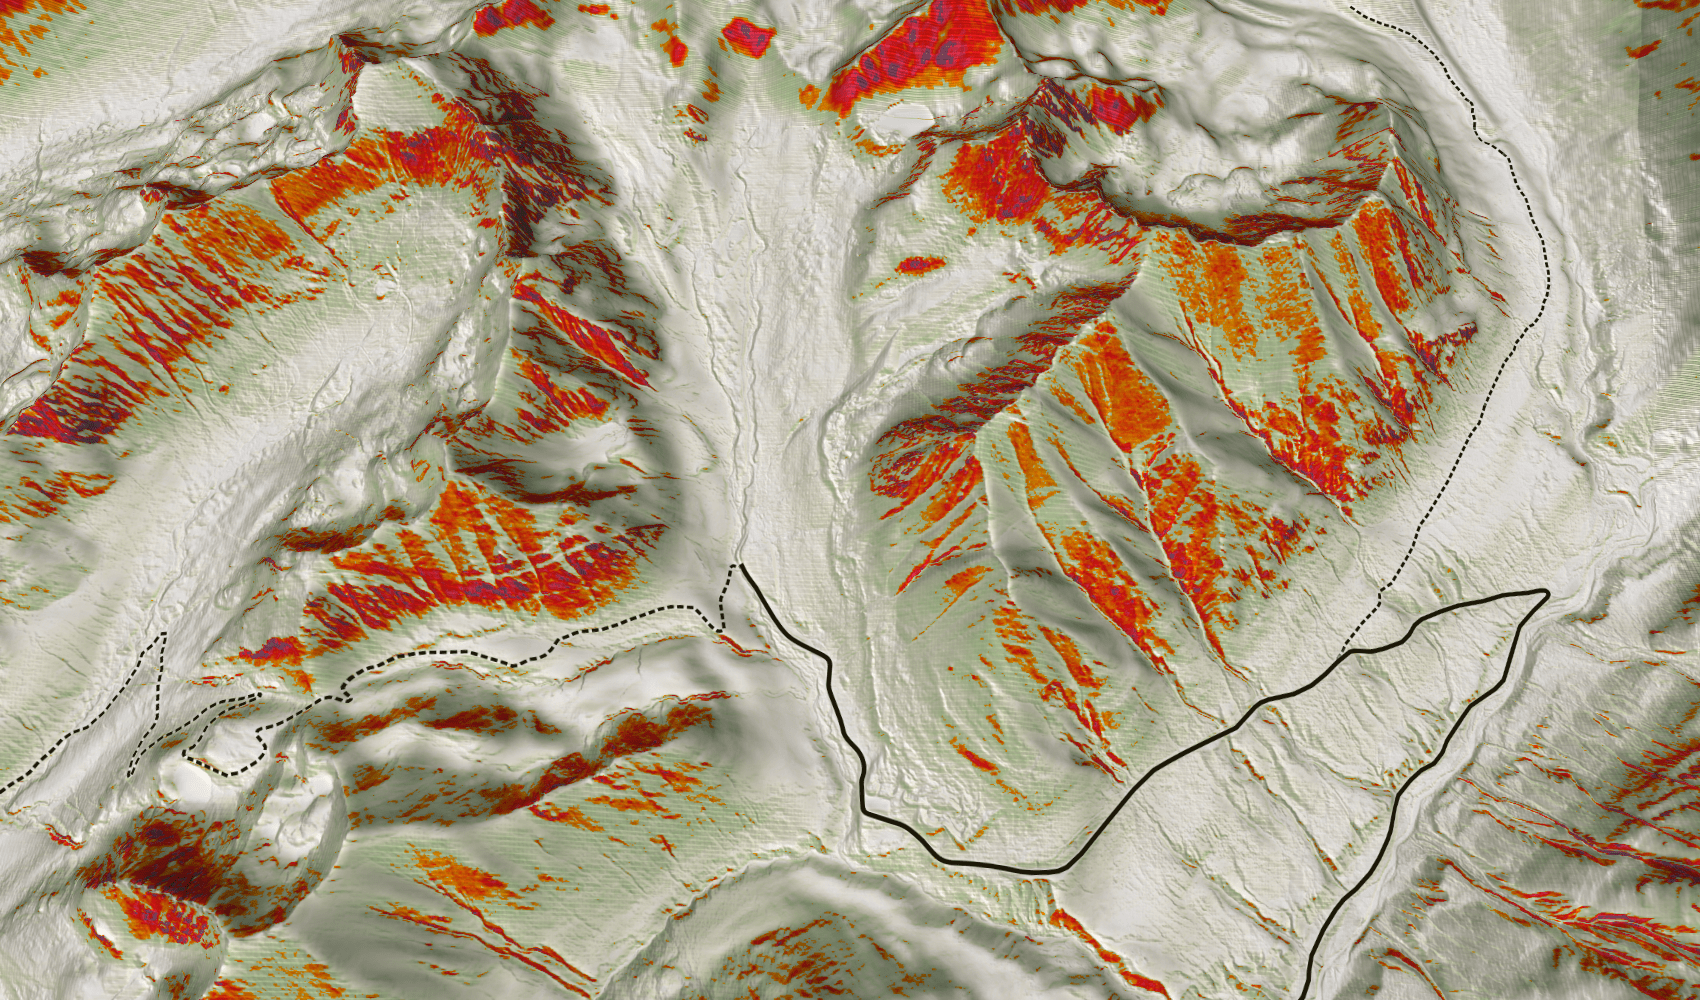
Because my mind is on avalanche safety (I got a rare slot for a Avy 1 course coming up), here is an attempt at visualizing slope angle around Hatcher Pass with a slight 3D perspective.
I wanted to deemphasize the green slopes and draw attention to the most important terrain - between 30 and 45 degrees…especially around the 38 degree range. Anyway, it was harder than I expected to get a version that I like.
This uses Sentinel 2 imagery from EO Browser for the base and USGS 3DEP for slope angle and the DEM. I used QGIS. Also this is very experimental so don’t trust it.
Day 30: Remix - Cold War Missle Site Imagery from 1964 and Modern Ski Trails at Kincaid Park #
I remixed some old aerial imagery with new ski trail features from Open Street Map. This shows what is now Kincaid Park on August 14th, 1964 when it hosted Nike Hercules ground-to-air missiles intended to defend against Soviet bomber aircraft approaching Alaska. And modern day ski trails.
I just wanted to see the what military in relation to the ski trails. There are still at least two bunkers that are in still use for trail maintenance and ski stuff.
The color infrared image is from exactly 20 years later on August 14, 1984. This was after the site was decommissioned and turned over to Municipality of Anchorage to expand Kincaid Park.
The imagery is downloaded from USGS earth Explorer. 1984 image is from NASA AMES Research Center, the 1964 image is unclear but is labeled EROS Miscellaneous. the modern imagery is from the state of Alaska Open Data. This uses QGIS.